One of the biggest criticisms of PMax is that it’s basically an advertising black box.
Money goes in, money comes out, but there’s not a lot of clarity over exactly what happens in the middle.
Honestly: I’m sympathetic to Google here because I think they’ve built an AI even they don’t 100% understand because it’s going to behave differently for every brand, product, and category based on small changes in assets like the size of your listing groups, etc.
This script (not mine, to be clear!) is designed to provide some more clarity so you can see what your PMax is actually doing with its budget to serve ads.
Important caveat: I hate Display. By default, if I see much Display as a placement I want to get that money over to Meta/Facebook/Instagram ASAP because it’s better spent there BUT I do appreciate that it has a place in the PMax ecosystem so I won’t fight it appearing.
But basically what we really want to find, especially for eCommerce brands, is a good understanding of how much of our PMax campaign budget is being allocated specifically to Shopping placements (perfect) and Search (also great).
Personally, I’ve seen really interesting results from these scripts.
For example, a client whose script output I’ll show you later on gets a lot of Shopping placements in Australia and New Zealand but over in the UK we see a lot of Search — and our results aren’t as good! We’re much newer to that market but that’s the kind of interesting insight we get with this report that can help us either a) improve our product feeds and landing pages for the UK market or b) find other ways to try to force Shopping placements — eg. just a pure Shopping campaign.
Alright, let’s jump in.
To use this PMax script to see your Performance Max channel placements without the upcoming channel performance report beta, we’ll need:
- A Google Sheet — for which we’ll need a Google account so go ahead and make a Gmail account if you haven’t already. Use a free Gmail address if you need to.
- We need this template spreadsheet Duplicated. Click Make A Copy and give it an appropriate name.
- Then go to your Google Ads account. Go to Tools > Bulk Actions > Scripts. Click the blue + icon to add a new script. Copy the script from here. For ease, click the copy icon above the code, next to the button that says ‘Raw.’
- Delete everything that’s automatically added to your new script. Then paste the script that’s in your clipboard.
- Now go to line 11 of your new script. It says:
let ss = SpreadsheetApp.openByUrl(”); - In between the two apostrophes, copy your duplicated Google Sheet URL.:
let ss = SpreadsheetApp.openByUrl(‘{{PASTEMEHERE}}‘); - Then click Run.
- Your ad account will likely ask you to authorise this script to run. Just follow the prompts. Note that it doesn’t make any changes whatsoever to your campaigns. All it’s doing is sending itself impression, click, placement, and product metrics and then turning those into graphs that are easy to read.
- Now, click back to Tools > Bulk Actions > Scripts. You’ll see your new script in a small table with a column that says ‘Frequency.’ Hover over the empty cell there and click the pencil icon that appears. Set a daily frequency for this script to run. I like to do it at either the start or end of every day so I get clean figures each morning.
Now let’s head back over to your new Google Sheet to see your PMax channel placement data.
This might take a little while to actually populate data for you but it should be pretty quick.
In the meantime, here’s what you’ll see and how you can apply it to your own campaigns.

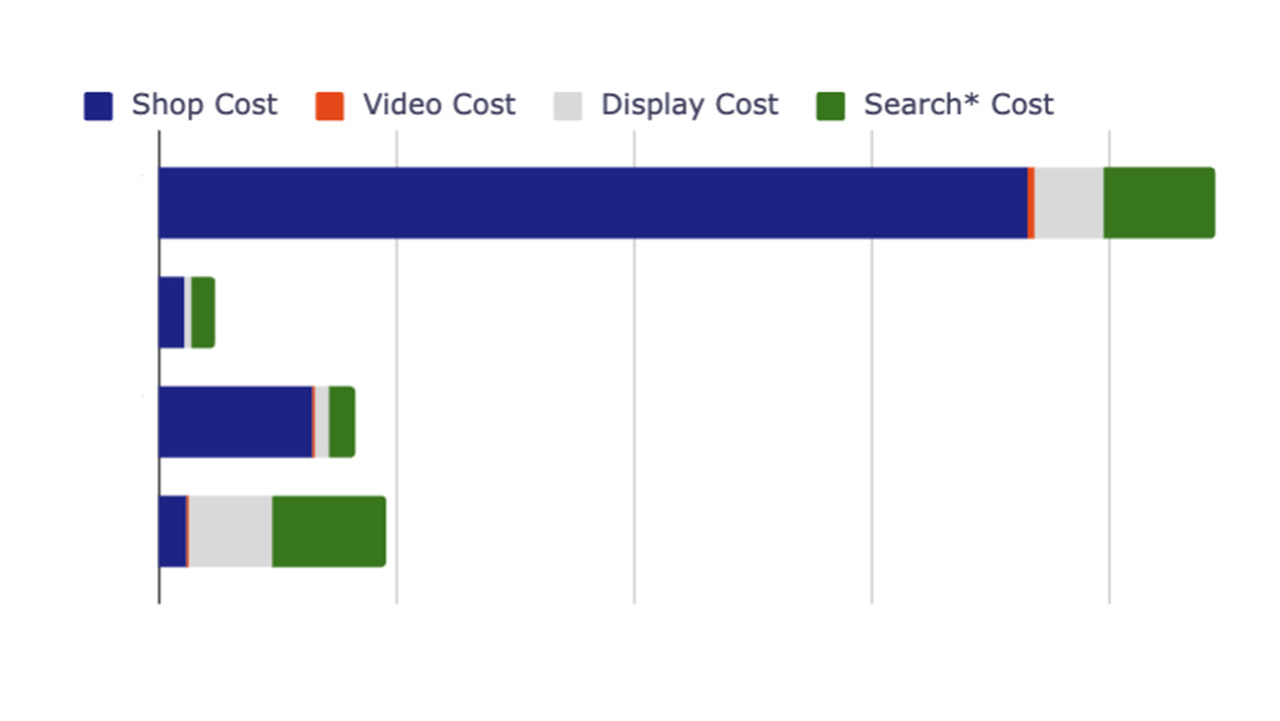
You’ll see above an example of an ad account spending a few thousand Australian dollars a day so yours might look different (maybe simpler).
Basically what we’re looking for is what proportion of your budget your PMax campaigns are spending on Shopping (blue), Search (green), and Display (grey). Video has a valuable place but I haven’t seen a lot of PMax campaigns serving a lot of video.
For ecommerce brands, we want to see a lot of Shopping (naturally) and then we want to see Search as the second biggest block.
If you see a lot of Display, you’ll want to consider excluding brand searches because that’s retargeting placements that are following your existing customers around the web. There are a range of ways you can do this.
What if you’re seeing something more complicated, you’re spending between a couple of hundred and a few thousand a day and you’re not sure what to do…